Monitoring, Dashboards, and Alerts for Apache Airflow

Understand your infrastructure, even if you don't have DevOps experience

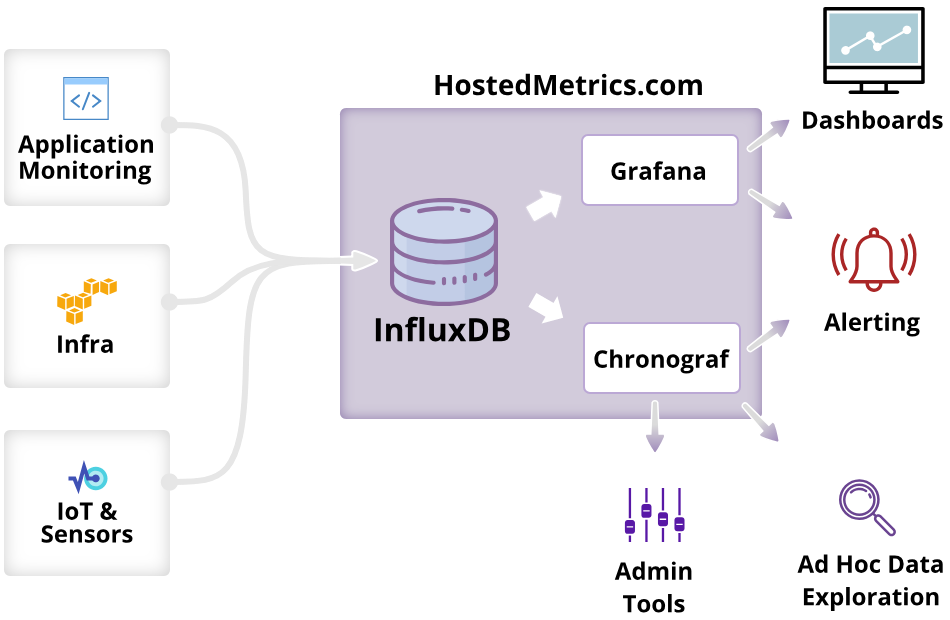
HostedMetrics offers a complete turnkey monitoring solution built with InfluxDB at the core. Simply specify HostedMetrics' server ip address, port, and api key in Airflow's configuration to start sending metrics. Optimized for infrastructure and application monitoring, it includes Grafana for your dashboard needs, and alerting too.

schedule a guided tour
an image of Airflow's logo

It probably sounds complicated. It's not.

You can get started within minutes, and without confusion.

Simply create an account and add this to your Airflow configuration:

[scheduler]
statsd_on = True
statsd_host = statsd.hostedmetrics.com
statsd_port = 48172
statsd_prefix = <your api key goes here>

Once you have configured Airflow, head over to your HostedMetrics dashboard, where you'll be able to go within Grafana and use the pre-built dashboards for your Airflow metrics.

testimonial quotes symbol

HostedMetrics is the perfect way to use Grafana and InfluxDB. It enables us to provide our Proptech solutions. After so much hassle setting this up manually on a server, we got up and running on HostedMetrics with no effort. The most important part for us is how HostedMetrics has used its unique skillset to deliver monitoring as a service. They also provide great support, and have helped us optimize our data and improve our dashboards.

Tommy Hagenes

CEO, Energy Control AS

Skip the Hassle

Easy Start

Get started quickly, and with confidence.

Sign up for an account and all the software will be ready for you to use right away:

no trial-and-error setting up
no tedious configuration
no misconfiguration

Zero Maintenance

Collect and make use of metrics without the hassle of running, scaling, and maintaining a metrics platform.

Stop worrying about server specs, uptime, maintenance, and configuration. We take care of all the details so that you can get back to building your product.

Exceptional Support

We take pride in treating you right!

We address customer requests quickly and with care.

Don't be surprised when you receive thoughtful messages instead of canned replies.

How HostedMetrics Works

Step 1 - Send Your Metrics Data

Collect metrics using various industry-standard protocols and sources, such as StatsD, MQTT, and CloudWatch.

Step 2 - Create Dashboards with Grafana

Create new dashboards, import your existing ones, or use publicly available ones. Visualize the things that matter to you.

Step 3 - Explore Your Metrics Ad Hoc

Get to the bottom of things by digging into your data on an ad-hoc basis to pinpoint the necessary details.

Step 4 - Set Up Alerts

Create alerts for the things that matter to you. Know right away when things are not as expected.

testimonial quotes symbol

When we were looking to establish the data backbone of our IoT solution for decentralized solar and battery storage systems, with HostedMetrics we managed to get a rock-stable, high-performing InfluxDB & Grafana instance up and running in minutes.

Since then, the HostedMetrics team has time and again proven not only to be highly responsive whenever we require help, support, and advice, but also very much proactive in providing ever better features and performance.

As a result, HostedMetrics for the foreseeable future is going to be an integral part of our technology strategy.

Start monitoring! See results in minutes.

We stand by our product. All our plans start with a free trial, no credit card required.

We'll answer all your questions

If you have any questions about HostedMetrics, we will get back to you asap.

Ask Question

Schedule a free demo to see it in action

In a 20-minute demo we will show you the HostedMetrics platform and discuss whether it is a good fit for your monitoring needs.

Schedule Demo