How HostedMetrics Works
Step 1 - Collect Metrics Data
Application Monitoring
StatsD
StatsD makes it easy to collect and aggregate metrics with practically no overhead for your software. And because it uses the UDP protocol, error handling is not needed.
with metrics.timer('name.task_duration' + tags):
data = func()
metrics.gauge('name.items_count' + tags, len(data))
InfluxDB Line Protocol
When you want to store all your data unaggregated, the InfluxDB line protocol and the many client implementations available for it make it easy to send your data just as easily as with StatsD.
Prometheus Pull Targets and PushGateway
Prometheus offers various ways to ingress data. Use your exposed pull targets, send data to the PushGateway if you have short-lived processes, or just use our StatsD endpoint for aggregation.
Infrastructure Monitoring
Simply provide read access for HostedMetrics and your metrics data will be pulled in and ready to use on dashboards.
Use our integrations to pull metrics from your infrastructure of choice: AWS CloudWatch, Microsoft Azure, or Google Cloud Platform. Keep an eye on Docker, Kubernetes, Nginx, databases, and more.
Internet-of-Things
Node-RED
Node-RED is a popular tool for wiring together hardware devices, APIs and online services. Among other things, it provides an InfluxDB data sink. Simply provide the HostedMetrics connection details and configure the payload format to structure your data.
MQTT
The MQTT protocol makes it easy to transmit measurements from your IoT devices and sensors.
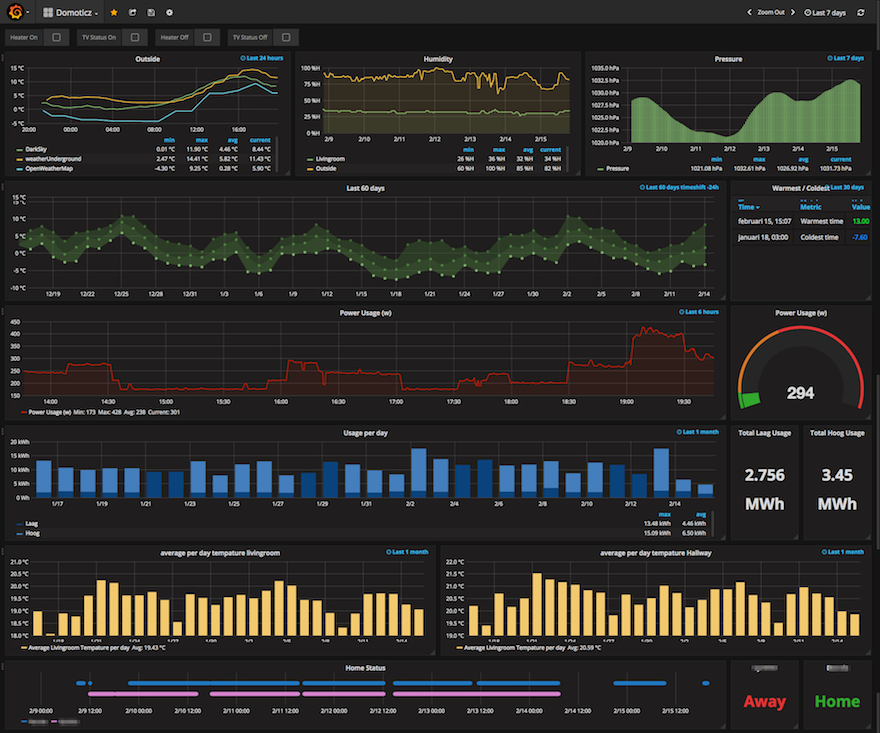
Step 2 - Use Grafana for Dashboards
Create new dashboards, import your existing ones, or use publicly available ones. Visualize the things that matter to you.
Make use of additional types of charts, such as heatmaps and candlesticks. HostedMetrics includes quality public Grafana chart plugins by default.
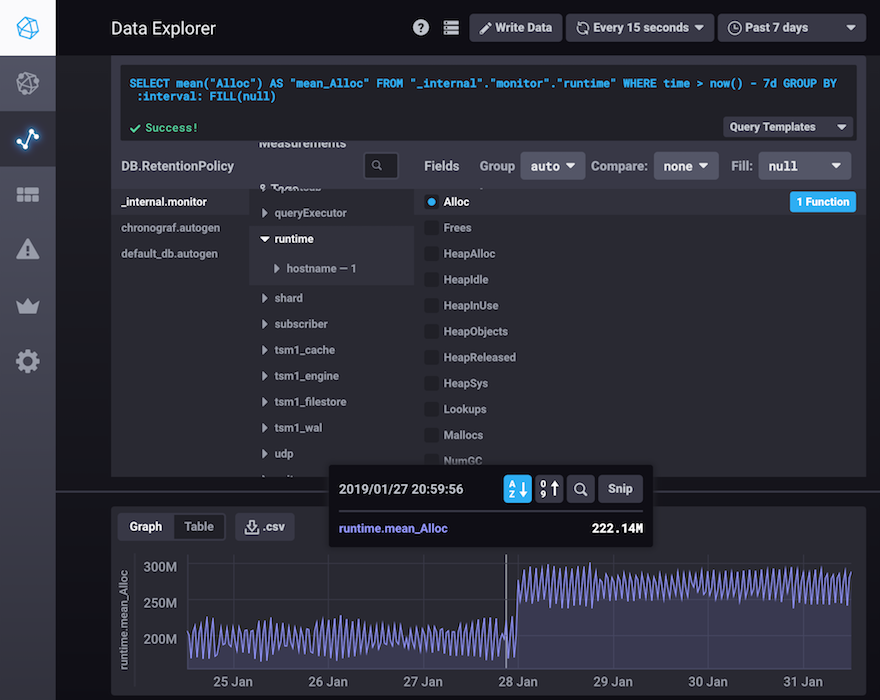
Step 3 - Explore Your Metrics Ad Hoc
Sometimes dashboards don't paint the picture in quite enough detail. Get to the bottom of things by digging into your data on an ad-hoc basis until you pinpoint the necessary details. Both InfluxDB and Prometheus come with data exploration tools that make it easy to investigate your metrics.
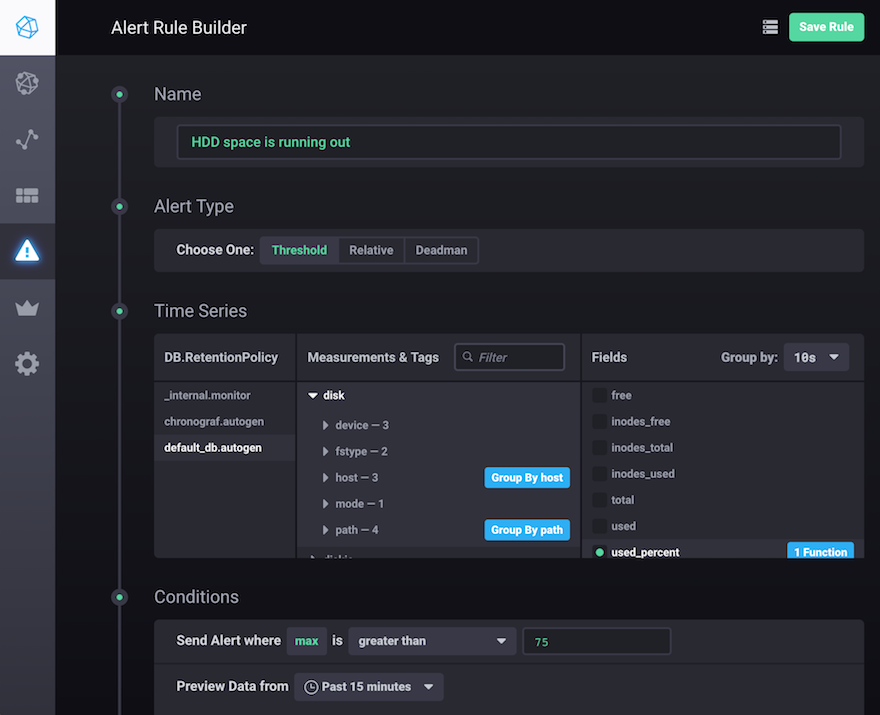
Step 4 - Set Up Alerts
Create alerts for the things that matter to you. Know right away when things are not as expected. Choose your preferred notification channel, be it emails, PagerDuty, or webhooks.