Hosted InfluxDB
and Grafana as a Service

Turnkey solution for your monitoring needs

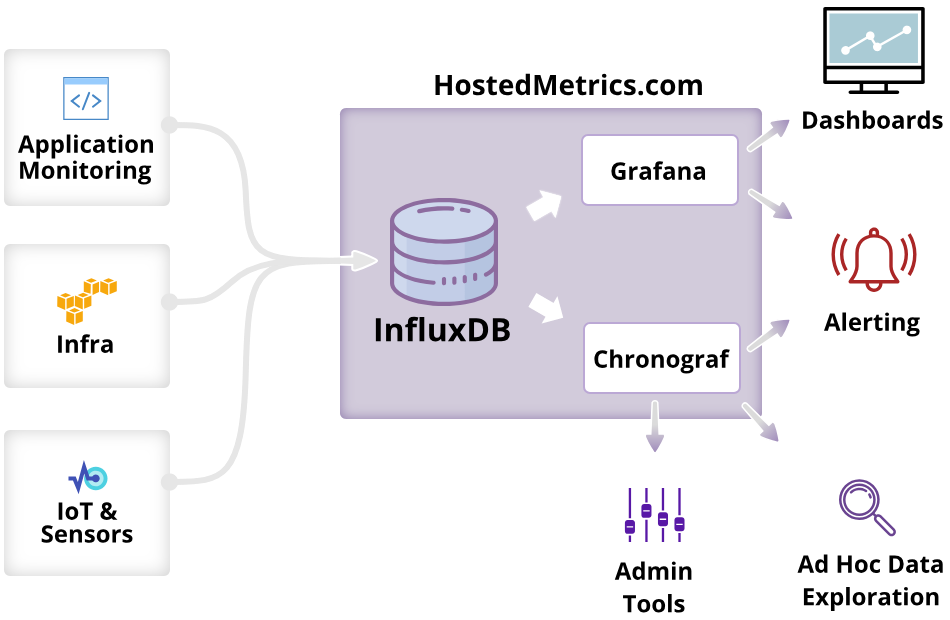
HostedMetrics offers a complete end-to-end infrastructure and application monitoring solution built with InfluxDB at the core. Ready the moment you log in. It includes Grafana for your dashboard needs, and alerting too. Transmit your data with straightforward support for industry protocols and tools, such as StatsD, MQTT, and AWS CloudWatch.

schedule a guided tour
a stylized screenshot of a Grafana dashboard

Skip the Hassle

Easy Start

Get started quickly, and with confidence.

Sign up for an account and all the software will be ready for you to use right away:

no trial-and-error setting up
no tedious configuration
no misconfiguration

Zero Maintenance

Collect and make use of metrics without the hassle of running, scaling, and maintaining a metrics platform.

Stop worrying about server specs, uptime, maintenance, and configuration. We take care of all the details so that you can get back to building your product.

Exceptional Support

We take pride in treating you right!

We address customer requests quickly and with care.

Don't be surprised when you receive thoughtful messages instead of canned replies.

testimonial quotes symbol

HostedMetrics is the perfect way to use Grafana and InfluxDB. It enables us to provide our Proptech solutions. After so much hassle setting this up manually on a server, we got up and running on HostedMetrics with no effort. The most important part for us is how HostedMetrics has used its unique skillset to deliver monitoring as a service. They also provide great support, and have helped us optimize our data and improve our dashboards.

Tommy Hagenes

CEO, Energy Control AS

How HostedMetrics Works

Step 1 - Send Your Metrics Data

Collect metrics using various industry-standard protocols and sources, such as StatsD, MQTT, and CloudWatch.

Step 2 - Create Dashboards with Grafana

Create new dashboards, import your existing ones, or use publicly available ones. Visualize the things that matter to you.

Step 3 - Explore Your Metrics Ad Hoc

Get to the bottom of things by digging into your data on an ad-hoc basis to pinpoint the necessary details.

Step 4 - Set Up Alerts

Create alerts for the things that matter to you. Know right away when things are not as expected.

Leverage the Best Open-Source Tools

InfluxDB
InfluxDB is a metrics platform built from the ground up to handle high write and query loads. It is a custom high-performance datastore written specifically for timestamped data, including DevOps monitoring, application metrics, IoT sensor data, and real-time analytics. InfluxDB also offers a SQL-like query language for interacting with data.
Grafana
Build beautiful dashboards to visualize and showcase your data and its trends. Use Grafana's APIs to configure your dashboards and alerting straight from your CI/CD pipeline.
Telegraf
Run the Telegraf agent on your servers to collect metrics for your infrastructure. We also provide a configurable Telegraf server on our end if you would like to use it for its data piping and transformation capabilities.
Kapacitor
Configure alerts with this real-time streaming data processing engine. Have them delivered to your inbox, Slack, PagerDuty, and various other tools.
Chronograf
Explore your data ad-hoc, perform admin tasks, and create dashboards.
StatsD
HostedMetrics provides a StatsD endpoint. StatsD is the easiest and simplest way to collect custom metrics from within your application code.

Integrate with the Products You Use

StatsD

Painlessly generate and push application metrics to HostedMetrics

Amazon CloudWatch

See the performance of your EC2 instances, RDS databases, and more, in your HostedMetrics dashboards

MQTT

Easily configure your IoT devices to send their data to HostedMetrics

Amazon Web Services

Pull in metrics from specific AWS services into your HostedMetrics dashboards

Microsoft Azure

Sync metrics from your specified Azure resources into your HostedMetrics account

Google Cloud Platform

Aggregate all your infrastructure metrics into your HostedMetrics dashboards

Kubernetes

Verify that your Kubernetes pods are healthy and running

Docker

Receive all important performance data from your Docker containers

Nginx

Easily monitor the performance of your web server instances

Github

See your Github commits as timeline annotations on your charts

CircleCI

See your codebase deployments as timeline annotations on your dashboards

Collectd

Gather system statistics and store them all in HostedMetrics

Email

Receive an email whenever an alert is triggered

Slack

Stay informed of alerts right in your preferred Slack channels

Telegram

Receive immediate alert notifications in your Telegram rooms

webhooks

Set up a webhook to process your triggered alerts as soon as they occur

PagerDuty

See your alerts as notifications in PagerDuty

VictorOps

Process your alerts through the VictorOps incident platform

... and more!

We Work with You

Knowledgeable and Attentive

HostedMetrics is the best choice for onboarding and continued support.

There are no front-line customer support ticket persons. Expect attentive and knowledgable engineering answers instead of frustrating canned replies.

Onboarding Support

Not everyone has the right personnel on site. We're ready to help you get on board, whether you need help at the architecture level or to finesse the visual details of your Grafana dashboards.

Consulting Services

We offer consulting services. Whether you need someone to create Grafana dashboards, set up your infrastructure, or architect your data flows. Just ask!

testimonial quotes symbol

When we were looking to establish the data backbone of our IoT solution for decentralized solar and battery storage systems, with HostedMetrics we managed to get a rock-stable, high-performing InfluxDB & Grafana instance up and running in minutes.

Since then, the HostedMetrics team has time and again proven not only to be highly responsive whenever we require help, support, and advice, but also very much proactive in providing ever better features and performance.

As a result, HostedMetrics for the foreseeable future is going to be an integral part of our technology strategy.

Start monitoring! See results in minutes.

We stand by our product. All our plans start with a free trial, no credit card required.

We'll answer all your questions

If you have any questions about HostedMetrics, we will get back to you asap.

Ask Question

Schedule a free demo to see it in action

In a 20-minute demo we will show you the HostedMetrics platform and discuss whether it is a good fit for your monitoring needs.

Schedule Demo